
PTE Made Easy·DIspeaking Reading time: 14 minutes 6–7 items
    Made Easy

    Describe Image

    Describe Image (DI) is a Speaking task where you describe a graph, chart, map, picture or process using clear academic language and natural intonation. On this page: an overview of the task, top strategies for the 25-second prep and 40-second response, sample answers and common mistakes to practise with your trainer, the most repeated 2026 images, and a guided task worksheet.

    Chapter

    Overview

    • Time to study the image:

      25 seconds

    • Time to record your response:

      40 seconds

    • Number of these tasks:

      6–7

    Describe Image tests your ability to describe — through speaking — a graph, chart, map, picture or process diagram, using your knowledge of grammar, vocabulary and intonation.

    • You will see an image and the task instructions on the screen.
    • You have 25 seconds to look at the image, plan, and make brief notes.
    • You then have 40 seconds to record your description into the microphone.
    • This task only tests your speaking skills (Content, Pronunciation, Oral Fluency).
    Scored by AI + Human expert review

    How Describe Image contributes to your score

    AI
    scoring
    Human
    review
    0%

    Speaking

    0%

    Overall

    Your voice → analysed by AI + human expert → contributes 15% to Speaking and 6% to Overall.

    Watch — Describe Image walkthrough

    Official PTE School walkthrough — how to answer Describe Image.

    How the test screen works

    The screen below is annotated with green markers (1–5) placed right next to the element they describe. Each marker is explained on hover — they cover the timer, instructions, image stimulus, recording status box and the Next button.

    PPTE Academic - Candidate Name
    Time Remaining 00:24:11 12 of 33
    1The timer shows the time left for all tasks in this part of the test.

    Look at the image below. In 25 seconds, please speak into the microphone and describe in detail what the image is showing. You will have 40 seconds to give your response.2Read the task instructions carefully — you have 25 seconds to study the image, then 40 seconds to describe it.

    Recording in 25
    0:00 / 0:254After 25 seconds, the recording status box changes to ‘Recording’. Speak immediately. After 40 seconds — or three seconds of silence — it switches to ‘Completed’.
    Describe image — exam stimulus3Study the image. Identify the title, axis labels, key data points and the overall trend or main idea.
    5Click ‘Next’ to go to the next task — only after the status shows ‘Completed’.

    Hover the green markers to see what each part of the screen does.

    What this task tests

    Skill assessed

    Speaking

    Score weight

    up to32points

    The AI scorer checks

    Fluency

    Speaking fluently at a natural speed

    Pronunciation

    Using clear pronunciation

    Vocabulary

    Using a wide range of vocabulary to describe data, trends and visuals

    Criterion

    Organising your description in a logical order (overview → details → conclusion)

    Intonation

    Using appropriate intonation, stress and linking

    Chapter

    Top Strategies for Success in Describe Image

    Practise organising your descriptions into a logical structure.

    Introduction (what the image shows in general)
    Features (in the order you see them)
    The most significant feature
    Introduction
    Main point
    Other details
    An obvious conclusion (that can be drawn from the image)
    Introduction
    Comparisons and contrasts
    Any unusual features

    Practice Tips

    Follow To Succeed
    1. 1

      Find some graphs, charts, maps, plans or tables from books, newspapers, academic or government websites to practise with. Try to find a variety of examples of each type of image.

    2. 2

      Practise identifying and describing the most significant features of an image (e.g. the biggest change or the largest and smallest differences) and the relationships between them.

    3. 3

      Record yourself on your mobile phone or other device as you practise describing graphs, charts, etc. Listen afterwards to the organisation of your talk, and to your stress, intonation, rhythm and pronunciation. Start with untimed practice and later practise under timed conditions.

    4. 4

      Practise in an environment with other people talking around you – for example, with the TV / radio on or in a busy place with other people around. There are likely to be people talking at the same time as you in the PTE-A exam room.

    5. 5

      Practise drawing conclusions. For example, if the image shows that more people take trains than buses in a particular city, the conclusion at the end of your talk might be that the city's train network is more convenient for commuters than the bus network. The conclusions should be logical and reasonable given the data.

    6. 6

      Practise giving implications. In the example above, you could say: If you visit this city, you're more likely to travel by train than by bus.

    7. 7

      Practise intonation when describing images. Note that:

      • the tone of voice usually falls at the end of each point.
      • if two things are contrasted, the first point usually has rising intonation and the second usually has falling intonation. For example,

    This suggests that the city's train network might be more convenient for commuters than the bus network.

    “While the number of women in employment rose, the corresponding number of men fell.”

    Quick tips — Do this, not that

    • Tip 01

      You start with a clear one-sentence overview.

      You don't list every single number on the chart.

    • Tip 02

      You highlight 2–3 main features.

      You don't read the data left-to-right with no comparison.

    • Tip 03

      You use academic vocabulary (rise, peak, plateau, decline).

      You don't use vague words like 'goes up' or 'goes down' repeatedly.

    • Tip 04

      You speak for the full 40 seconds.

      You don't stop after 15 seconds because you've 'run out of ideas'.

    • Tip 05

      You finish with a brief conclusion.

      You don't end mid-sentence because the mic cut off.

    • Tip 06

      You speak with a natural pace and clear intonation.

      You don't read your notes word-for-word in a flat monotone.

    Chapter

    Practice now with your trainer

    PPTE Academic - Candidate Name
    Time Remaining 00:24:11 Practice

    Look at the image below. In 25 seconds, please speak into the microphone and describe in detail what the image is showing. You will have 40 seconds to give your response.

    Recording in 25
    0:00 / 0:25
    Describe image — exam stimulus

    Try this Describe Image without a time limit

    Listen to the model answer, then record your own response. Compare your version — did you cover the highest and lowest values, give a clear overview, and finish with a conclusion?

    Model recording

    Describe Image — Model Answer

    This is a model answer for the practice chart above. Notice how the speaker opens with an overview, highlights the highest and lowest values, and ends with a one-sentence conclusion.

    Want a coach to score your attempt? Send your recording on WhatsApp and we'll reply with personalised feedback.

    Send on WhatsApp

    Reflecting on your practice

    Private to you — tick each item you actually did. Saved on this device only.

    0/10

    Common Mistakes in Describe Image

    These are the pitfalls that lower most students' scores — watch the video and read the fixes.

    Don'tSpeaker without proper headset positionToo close

    Mic too close or off-position · voice distorts

    DoSpeaker with headset mic at correct distance~3 cm

    Headset on · mic ~3 cm from the side of mouth

    01

    Reading every number on the chart

    Problem · Many students try to mention every value on the axis, run out of time, and finish mid-sentence. The scoring engine rewards a clear overview + main features, not raw data.

    Fix · Pick the 2–3 most striking features (highest, lowest, biggest change) and one clear data point. Leave the rest out.
    Don't
    Audio RecorderRecording…
    0:000:40
    Next

    Clicking Next while recording → answer cut off

    Do
    Audio RecorderCompleted
    0:000:40
    Next

    Wait for ‘Completed’, then click Next

    02

    Long pauses while planning aloud

    Problem · If you pause for more than 3 seconds, the mic switches off and the response is marked Completed early — even if you only spoke for 12 seconds.

    Fix · Use filler phrases like 'In addition,' or 'Furthermore,' to bridge gaps while you think. Never stop talking until you've finished your conclusion.

    Watch — Common Mistakes in Describe Image

    Tap play to watch — the most frequent Describe Image mistakes and how to avoid them.

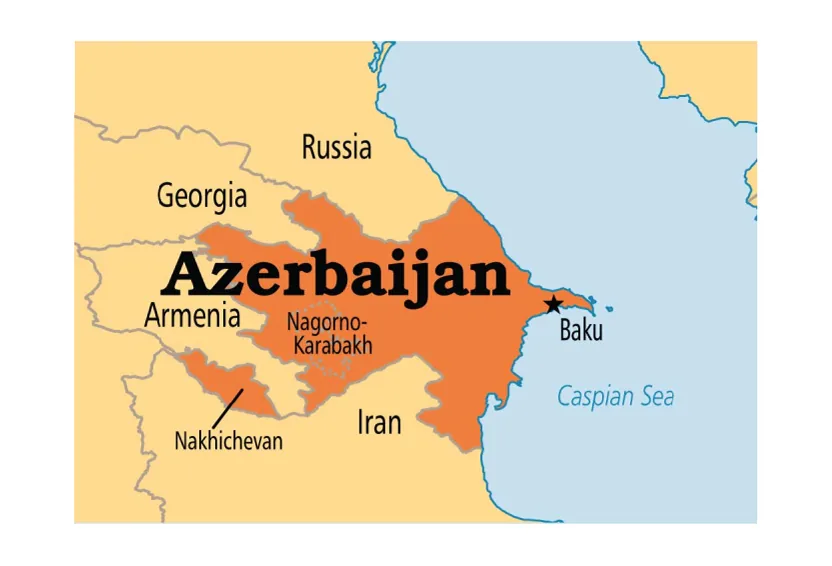
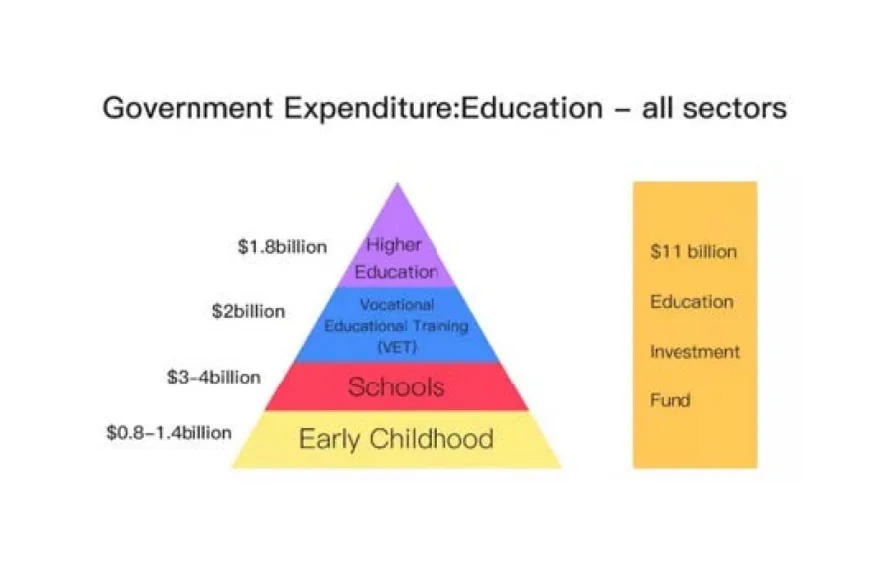
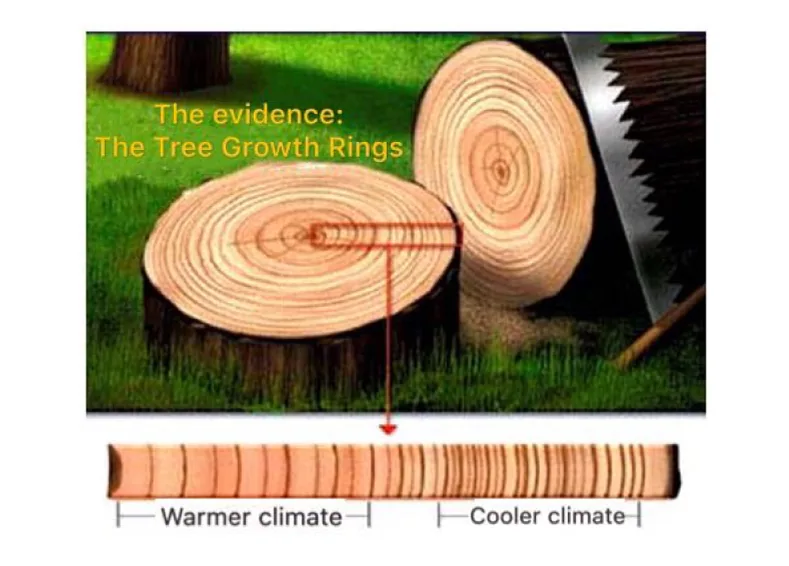
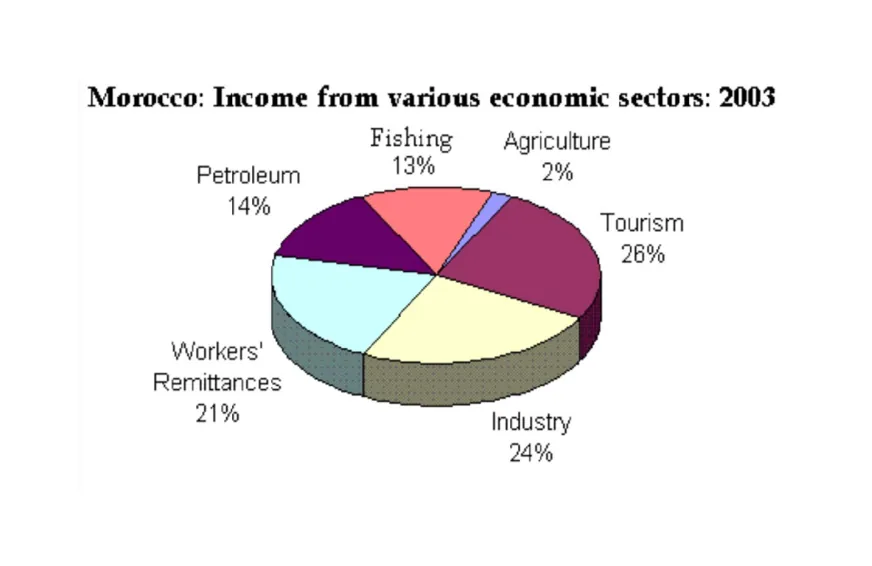
    Most Repeated Describe Image Questions in 2026

    Practise these recently recycled images aloud — record yourself for 40 seconds on each one and compare with the model structure (overview → main features → data point → conclusion).

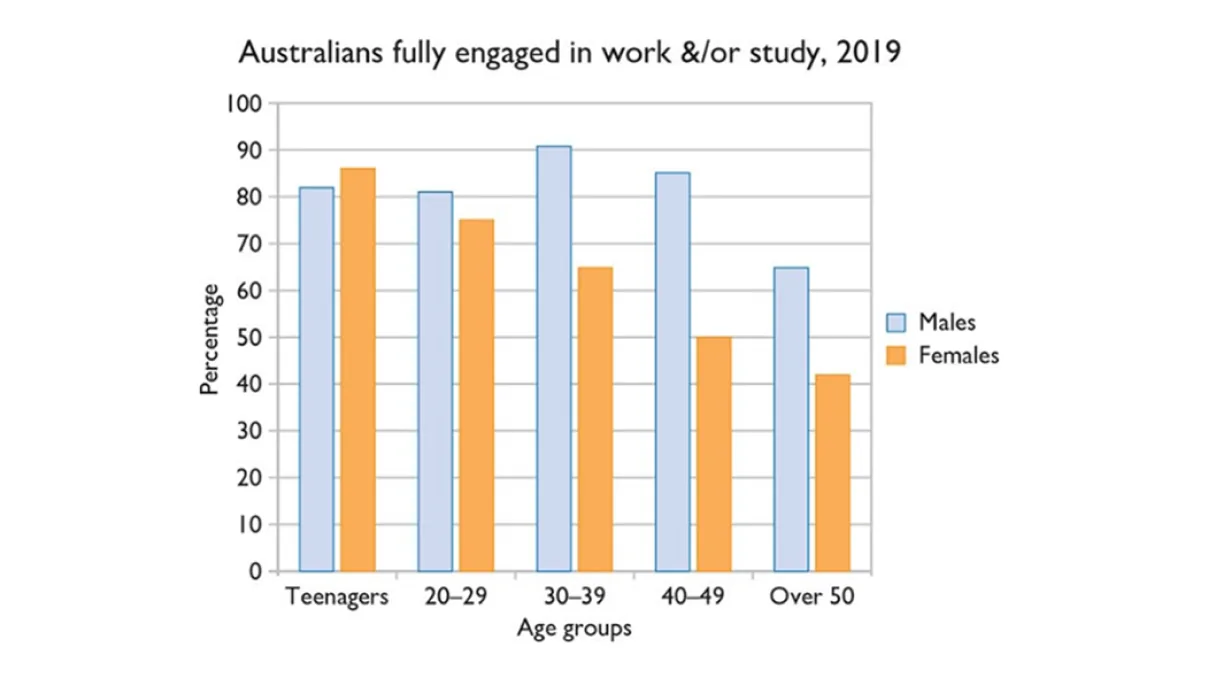
    1. 1
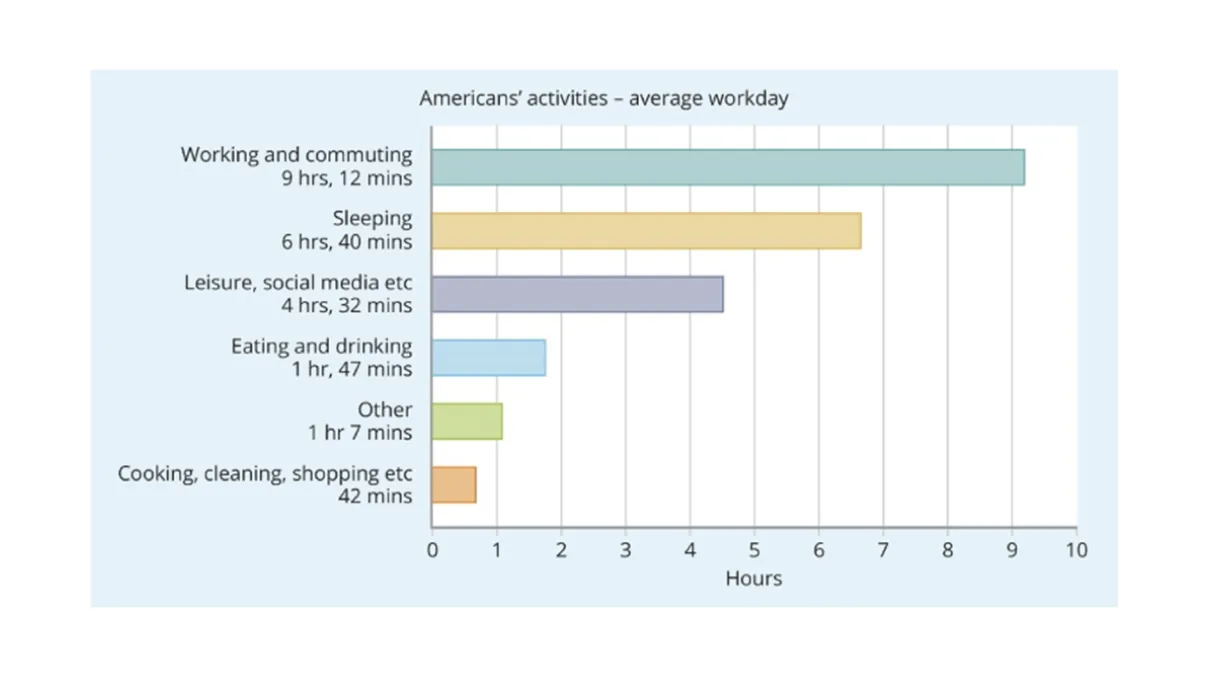
    2. 2
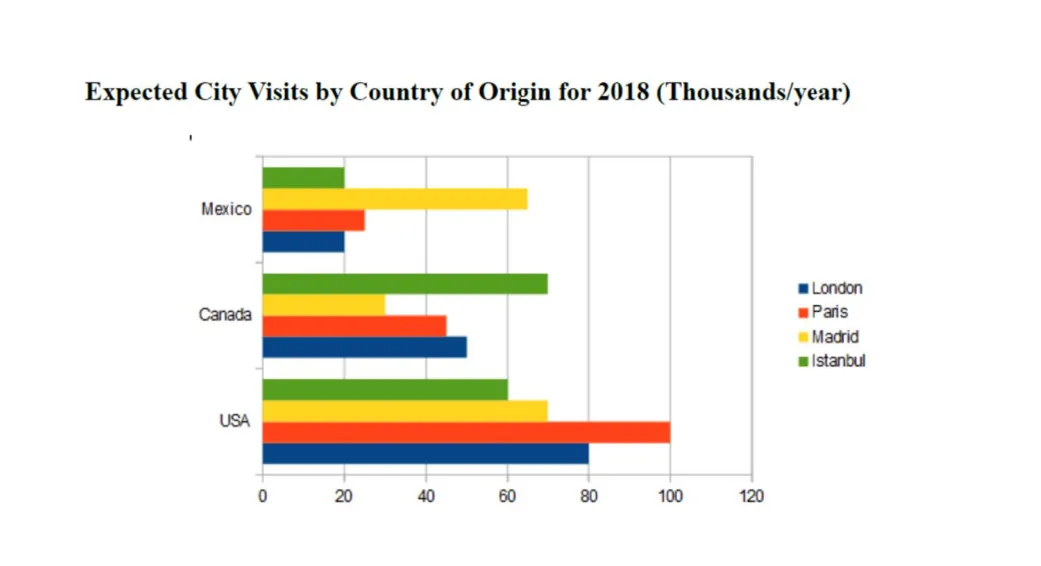
    3. 3
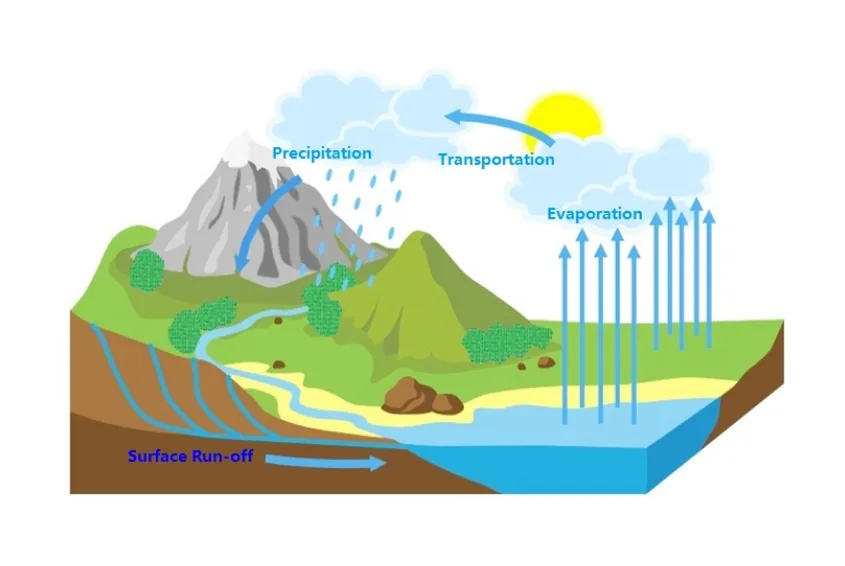
    4. 4
    5. 5
    6. 6

    Quick Tips & Strategies for a Better Score

    Focus on the main information in the image

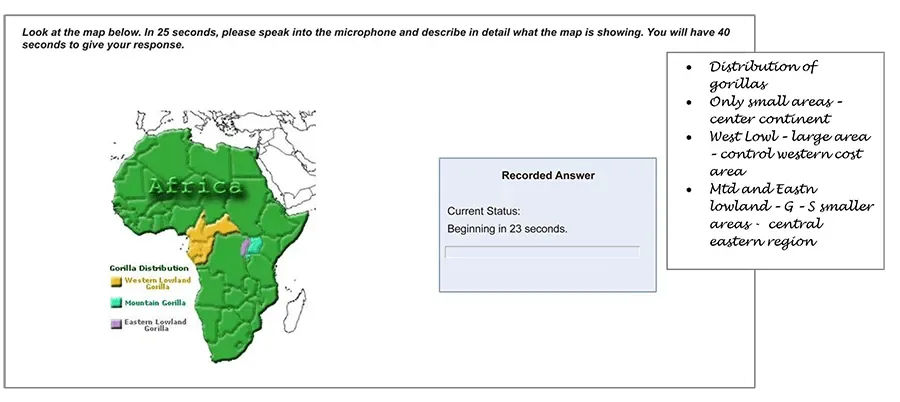
    When you look at the image ask yourself "What is the main idea being shown by the image?" and "What are the details relating to the main ideas?". Use your erasable note-board booklet to note down key ideas and phrases that relate to the main information and the explanatory details. These can be put into sentences when you start to speak.

    Africa map showing gorilla distribution with sample test-taker notes — main idea + supporting details.
    Organize your description of the image

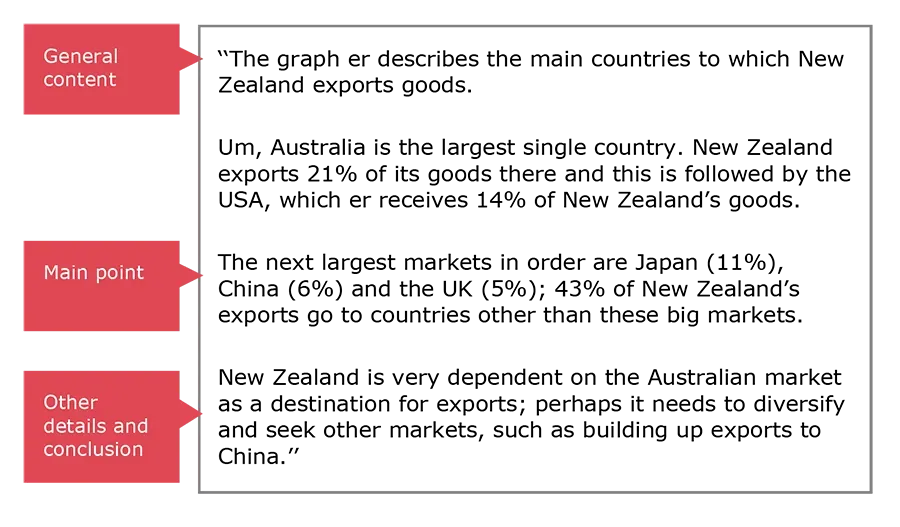
    If you organize what you say, you will get a better score. This is because a well-organized answer is more likely to cover the main information as well as the additional details, and also talk about implications or conclusions based on the information. Look at how this sample description is organized: General content → Main point → Other details and conclusion.

    Sample description structured into General content, Main point, and Other details / conclusion blocks.
    How Describe Image is scored

    Your score is based on three traits. Open each card to see what raises and lowers your score, with full band descriptors.

    Content for speaking tasks is rated on whether you say the right things — the words from the prompt (Read Aloud, Repeat Sentence) or the right ideas with detail (Describe Image, Retell Lecture, Respond to a Situation). For Describe Image / Retell Lecture / SGD / RTAS, a human also reviews Content.

    What raises your score
    • Use a template only as a frame — fill it with the actual data/ideas.
    • For Describe Image: state type → main trend → 2 specific data points → comparison → conclusion.
    • For Retell Lecture: topic → 3–4 key points → speaker’s conclusion.
    • Paraphrase — don’t repeat the prompt word-for-word.
    What lowers it
    • Memorised template with no real content from the image / lecture.
    • Listing labels (“There is bar one, bar two, bar three…”) without describing.
    • Stopping after 15s when 30–40s is allowed.
    Click a band to exploreMax 5
    5Full, accurate, nuanced
    • Covers all key features/ideas with accurate detail and clear relationships; uses varied vocabulary.

    Coach tip · If you can’t see a number on the chart, describe the trend instead — never invent data.

    • ◾Partial credit applies. No credit is given for no response or an irrelevant response.
    • ◾This task only affects Speaking, Oral Fluency and Pronunciation scores.
    • ◾Listening, Reading and Writing scores are not affected by this task.

    Sample Answers & Feedback

    Image prompt: 'Activities Americans aged 65 and over took part in over the past 12 months' (the practice chart above). Listen to two graded sample answers — each is from a test taker at C1 or B2 level — and read the trainer feedback.

    Sample Answer 1 · C1 — English-speaker referenceC1
    +

    Feedback

    • ◾The response opens with a clear one-sentence overview that names the chart type and the topic.
    • ◾Two or three main features are highlighted, with explicit comparisons between the highest and lowest activities.
    • ◾The speaker uses a wide range of academic vocabulary (e.g. 'the most popular', 'in contrast', 'roughly half') and natural linking.
    • ◾Pronunciation is clear, intonation rises and falls naturally to highlight key data points, and the response finishes with a brief conclusion.
    Sample Answer 2 · C1C1
    +

    Feedback

    • ◾Strong opening overview and a confident description of the highest and lowest values.
    • ◾Speech is fluent at a natural rate with no long pauses or false starts.
    • ◾Vocabulary is varied — uses 'plummet', 'whereas', 'roughly' rather than basic 'goes up / goes down'.
    • ◾One specific data point is quoted accurately. The response ends with a one-sentence conclusion before the timer.
    Sample Answer 3 · B2B2
    +

    Feedback

    • ◾Overview is present but slightly delayed — the speaker starts with a number before naming the topic.
    • ◾Main features are described, but the response lists data left-to-right rather than comparing highs and lows.
    • ◾Vocabulary is appropriate but limited — the same trend verb ('increase') is used several times.
    • ◾Pronunciation is clear and easy to understand. Minor hesitations affect Oral Fluency. No conclusion is given before the timer ends.
    Chapter

    Describe Image Task Worksheet

    Work through these nine steps to build a reliable Describe Image routine — from picking the right skills to self-assessing your final recording.

    1

    Pick the skills you'll need

    Step 1 of 9

    +

    Tick (✅) the skills you feel will be useful for Describe Image.

    2

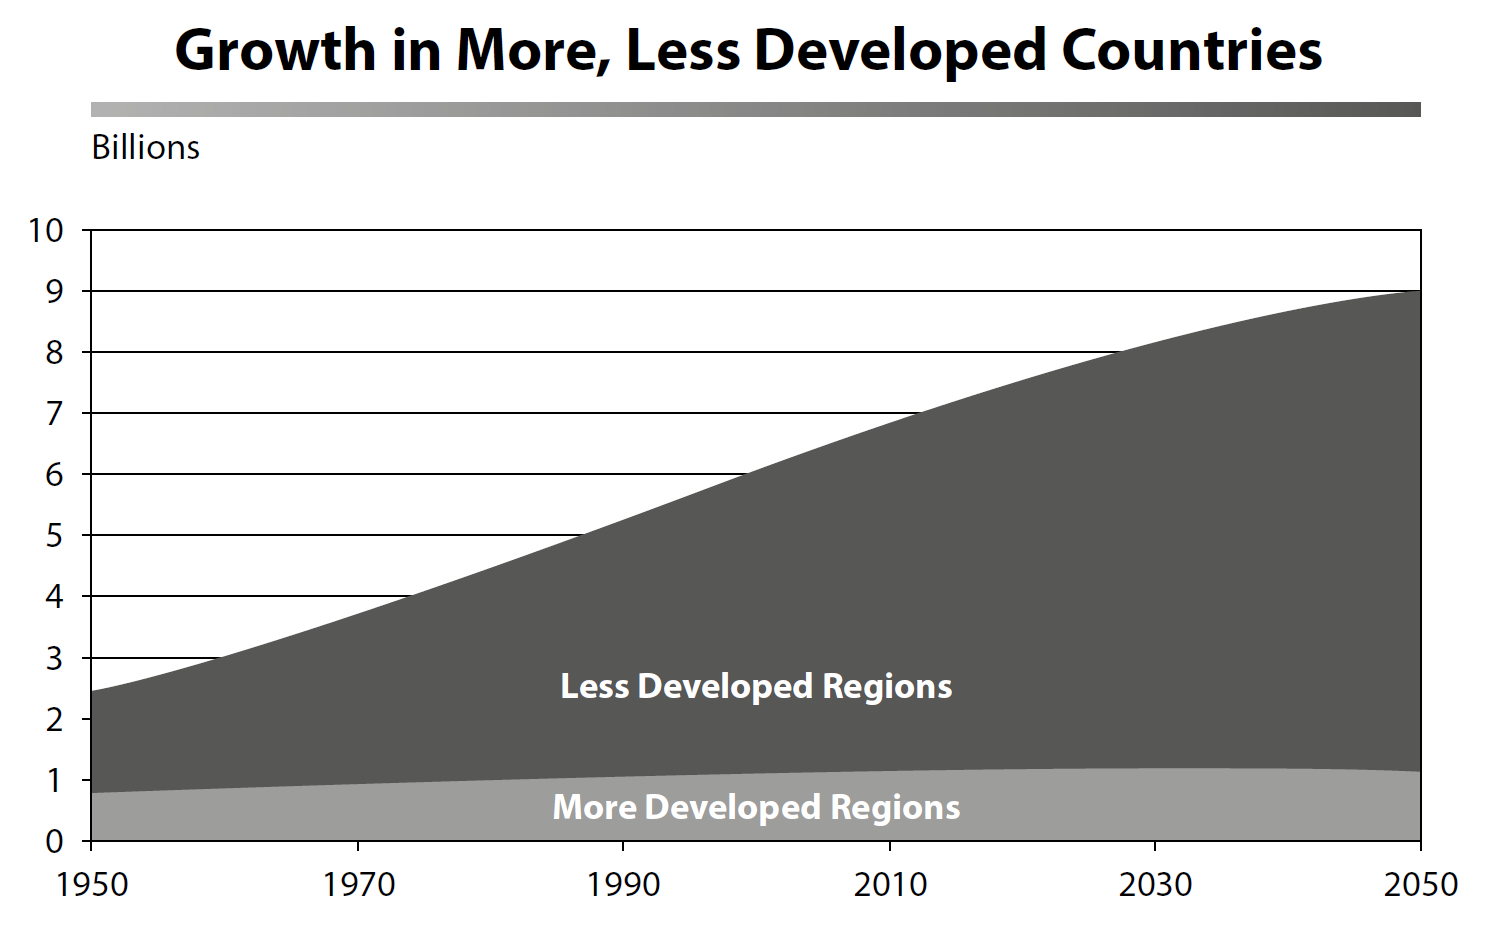
    Read the image — population graph

    Step 2 of 9

    +

    Look at the graph above. Answer the following questions in note form (just keywords) — these are exactly the kinds of notes you should make in 25 seconds during the real exam.

    Worksheet image — line graph showing world population growth over time.
    Worksheet image — line graph showing world population growth over time.

    1. What does the graph show? (topic in 3–5 words)

    2. What is the highest value, and when does it occur?

    3. What is the lowest value, and when does it occur?

    4. What is the overall trend (rise / fall / fluctuate)?

    5. Which two periods would you compare in your description?

    3

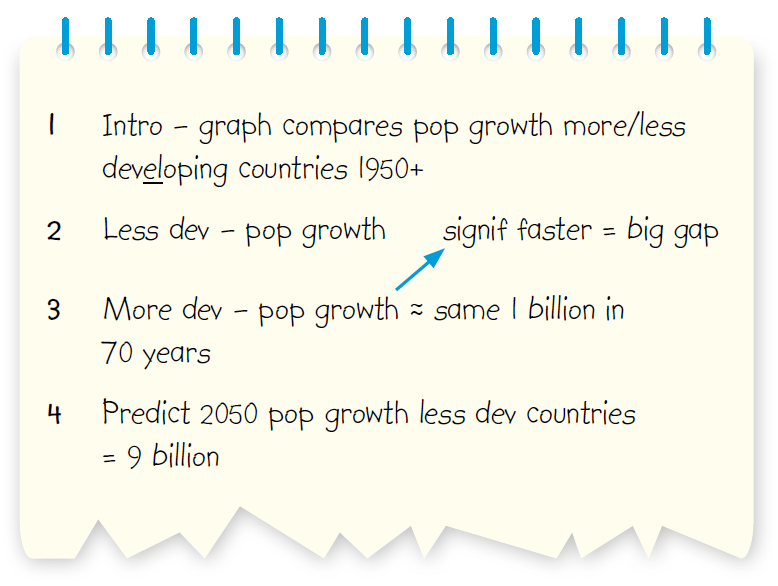
    Compare two test takers' notes

    Step 3 of 9

    +

    Read the two sets of notes (a and b) above. Decide which is more effective and why. Could you use either set to deliver a full 40-second description?

    Worksheet image — two sets of test taker notes for the population graph.
    Worksheet image — two sets of test taker notes for the population graph.

    1. Which set is more effective — a or b? Why?

    2. Could you use notes a or b to give a complete description?

    3. What would you add to the weaker set to make it useful?

    4

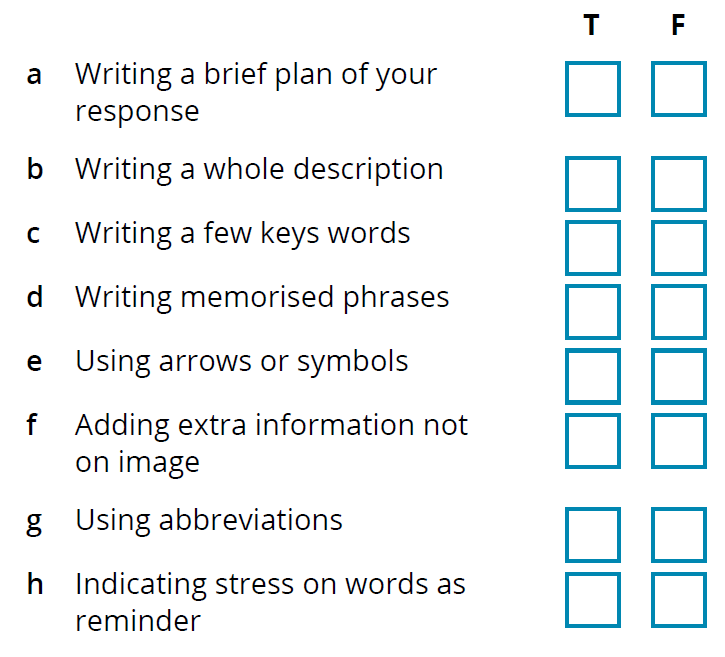
    Note-taking strategies — true or false?

    Step 4 of 9

    +

    Read each strategy from the image above. Tick the ones you think are TRUE for Describe Image note-taking.

    Worksheet image — note-taking strategies for Describe Image (true / false).
    Worksheet image — note-taking strategies for Describe Image (true / false).
    5

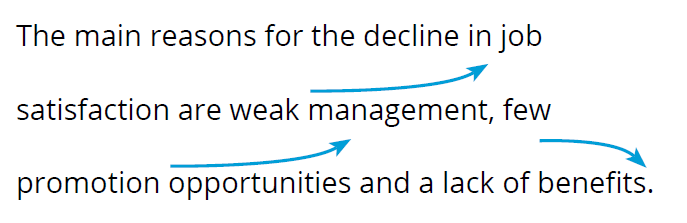
    Intonation — match the stress and rise/fall

    Step 5 of 9

    +

    Read the example sentence in the image. Tick the statements that match how the speaker should deliver it.

    Worksheet image — example sentence marked with stressed words and falling intonation.
    Worksheet image — example sentence marked with stressed words and falling intonation.
    6

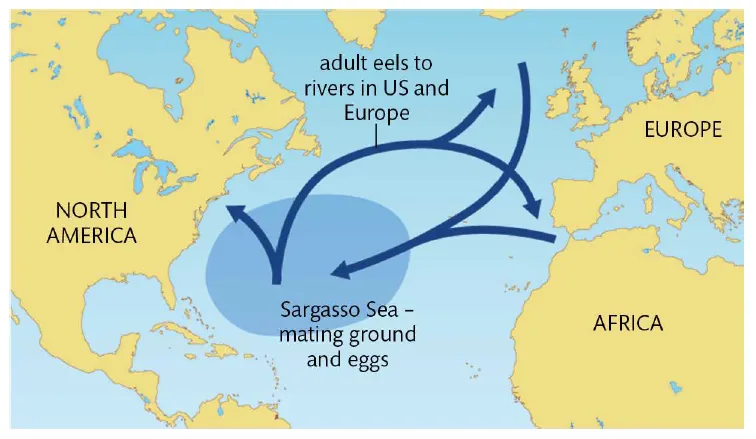
    Describe a map — eels migration

    Step 6 of 9

    +

    Look at the map above. Make notes for a 40-second description. Use map vocabulary (in the north of, to the east of, across the Atlantic, etc.).

    Worksheet image — map showing the migration route of European eels.
    Worksheet image — map showing the migration route of European eels.

    1. What is the topic of the map?

    2. Where does the migration start and where does it end?

    3. Which direction is the main movement (north, south, east, west)?

    4. Which two locations would you compare in your description?

    7

    Spot what damages a description

    Step 7 of 9

    +

    From the image above, tick (✅) every behaviour that lowers a Describe Image score.

    Worksheet image — common things that damage a Describe Image response.
    Worksheet image — common things that damage a Describe Image response.
    8

    Listen to a sample response and tick what you hear

    Step 8 of 9

    +

    Listen to the sample response for the population graph. Tick the items you hear in the recording.

    🎧 Model audio

    9

    Self-reflection checklist

    Step 9 of 9

    +

    Record your own 40-second response for the population graph. Listen back to your recording and tick the statements that are true for you.

    Recording is local-only

    All audio is captured in your browser using the MediaRecorder API. Nothing is uploaded — refresh the page to clear it.

    Keep going with Describe Image

    Useful Language for Speaking

    Open the Speaking Useful-Language toolkit

    A trainer-ready resource covering academic style, collocations, signposting, cause/effect, comparison, image description, hypothesis and estimation — every exercise has a hidden suggested answer. Use it for every speaking task.

    Open speaking resources