
What you'll see
Get familiar with the task.
This is a long-answer speaking question. You'll see an academic image — a graph, map, chart, table or picture — and describe it. You get 25 seconds to study the image, then 40 seconds to speak.
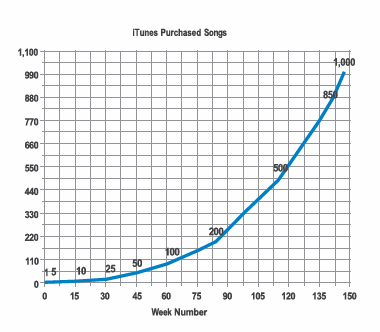
Look at the graph below. In 25 seconds, please speak into the microphone and describe in detail what the graph is showing. You will have 40 seconds to give your response.
Look at the image below. In 25 seconds, please speak into the microphone and describe in detail what the image is showing. You will have 40 seconds to give your response.
3 strategies that work
The mindset before the click.
- 1Strategy 1
Study the image in 25 seconds
Find the main ideas: What is happening? What are the smallest and biggest numbers? What's the trend?
- 2Strategy 2
Use the right statistical vocabulary
Pick the right verbs (rose, declined), adverbs (sharply, gradually) and prepositions ('from X to Y').
- 3Strategy 3
Structure: intro → body → conclusion
Open with what the image shows. Describe 2–3 main features with data. End with a one-line conclusion.
Try each strategy
Guided practice you can do alone or with a partner.
1Study the image in 25 seconds
You only get 25 seconds before the microphone opens. Use it to grasp the image — don't try to read every number.
- Identify 2–3 main ideas, e.g. for the iTunes graph: (1) slow growth for the first 60 weeks; (2) a rise around week 60; (3) sales shoot up after week 90.
- Support each idea with a data point: 'between week 1 and 60 only ~100 million songs were purchased', 'songs almost doubled in 30 weeks after week 60', '1,000 million by week 150'.
- If it's a time graph, look for the overall trend. If it's a picture or map, look for the main feature and its location.
2Use the right statistical vocabulary
Brainstorm a vocabulary bank you can re-use across all 6–7 Describe Image tasks in the test.
- Prepositions: 'from 1990 to 2010', 'between 2005 and 2015'.
- Movements up: increased, rose, grew, went up, climbed, shot up.
- Movements down: decreased, declined, dropped, went down, fell.
- Adjectives + adverbs: slight/slightly, gradual/gradually, sharp/sharply, sudden/suddenly, steady/steadily.
- No movement: remained steady, was unchanged, stabilised, plateaued.
- For pictures: foreground/background, in the upper/lower part, in front of, behind, on the right/left, bird's eye view.
3Structure: intro → body → conclusion
Keep your description simple and logical so the scoring engine can follow you.
- Intro: 'The graph shows / displays the number of iTunes songs purchased between week 0 and week 150.'
- Body: describe each main feature in order (time graphs = chronological; pictures = left → right or general → detail). Add one supporting data point per feature.
- Conclusion: 'The information indicates that iTunes sales grew exponentially after week 60.' or 'From the chart, we can conclude that…'.
- Never read your notes word for word. Speak in full sentences with natural intonation.
Look at the graph. In 25 seconds, identify the main features and plan your structure. Then describe it in 40 seconds.
Do it under time
Simulate the real test.
Press Start to run the real exam timing: 25-second prep, then 40 seconds to record your description. Compare your answer with the B1, B2 and C1 samples below.
Look at the image below. In 25 seconds, please speak into the microphone and describe in detail what the image is showing. You will have 40 seconds to give your response.
Compare & learn
Listen to sample answers and rank them.
Listen to all three responses. Try ranking them from weakest → strongest before reading the notes below each one.
Describes the content but doesn't discuss relationships between elements. Uneven rate, several hesitations and repetitions affect fluency. Pronunciation of vowels and consonants makes several words unclear. Limited control of simple grammar. ~39 seconds.
Describes basic elements but disorganised, with little discussion of relationships. Speed is acceptable with some long utterances. Some pronunciation errors blur words. Several grammar and vocabulary errors. ~30 seconds.
Major aspects of the graph are accurately described, with one minor misinterpretation of relationships. Several long runs of language at an even tempo. Appropriate word/phrase stress. Good control of grammar; precise vocabulary. ~35 seconds.
Tick each box only when you can do it without looking back. This unlocks your next chapter.